Written by
  Reviewed by
- The Savvy Promise
At Savvy, our mission is to empower you to make informed financial choices. While we maintain stringent editorial standards, this article may include mentions of products offered by our partners. Here’s how we generate income.
As part of Savvy’s ongoing research into consumer sentiment, especially in the automotive sector, we look at the global state of Electric Vehicle (EV) sales, trends, and what we can expect in the future.
- Global EV sales nearly hit 10 million in 2023, with China surpassing 2 million and the US reaching 1 million for the first time.
- Despite a projected 17.5% BEV share in 2024, government support for EVs is starting to decline.
- New battery tech promises to combat range anxiety, with Chinese firm Nio offering a 1,000km battery this year.
- 60% of EV owners globally are interested in buying used, creating a new market opportunity.
In 2023, Electric Vehicle (EV) sales passed a significant milestone: Almost 10 million EVs (9.97 million) were sold worldwide during the year, with China surpassing the two million mark and the US hitting one million sales for the first time. This showed an annualised EV growth of 28% across all analysed markets by PwC in their Electric Vehicle Sales Review 2024.
S&P Global predicts 88.3 million car (passenger or light commercial vehicle) sales worldwide in 2024, with a battery EV share of 17.5% – an increase of 39.5%.
However, the transition to EVs may not be as inevitable as one thinks. Despite upward growth in EV sales, national governments are beginning to roll back incentives on EV uptake, as well as impose protectionist policies to shield domestic manufacturing instead of relying on cheaper imports.
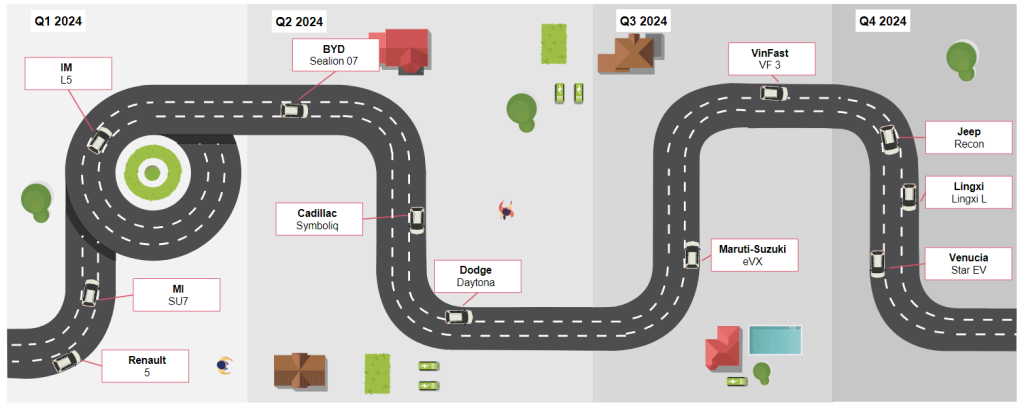
New BEV Launches Coming in 2024
Source: PwC, Electric Vehicle Sales Review Q4, 2023, pg. 8.
Referencing: S&P Global Mobility Light Vehicle Production forecast, December 2023 Release
Top EV models by market
The top EV model across the world’s biggest markets is the Tesla Model Y, taking out the highest selling position in Europe’s Top 4 economies (Germany, France, Italy, Spain), the United States, and China.
The Tesla Model 3 came in second place among the Euro Four and US, with the BYD Yuan Plus landing 2nd spot in China.
The third most popular EV in the Euro Four was the Fiat 500e; the Chevrolet Bolt in the US; and the BYD Dolphin in China.
Europe Top EV Models in 2023 – by Sales Volume Q1 – Q3 2023 (Germany, France, Italy & UK)
| Position | Model | Sales FY 2023 | Position Change |
|---|---|---|---|
| 1st | Tesla Model Y | 97,806 | 0 |
| 2nd | Tesla Model 3 | 53,553 | 3 |
| 3rd | Fiat 500e | 52,002 | 1 |
| 4 | Dacia Spring | 46,298 | 0 |
| 5 | Volkswagen ID.4, ID.5 | 41,790 | 2 |
| 6 | MG 4 | 38,339 | 1 |
| 7 | Peugeot E-208 | 31,366 | 1 |
| 8 | Vokswagen ID.3 | 29,231 | 0 |
| 9 | Skoda Enyaq | 28,823 | 1 |
| 10 | Renault Megane Electric | 26,340 | 1 |
Source: PwC Autofacts Analysis, Electric Vehicle Sales Review Q4, 2023, pg. 7.
USA Top EV Models in 2023 – by Sales Volume Q1 – Q3 2023
| Position | Model | Sales FY 2023 | Position Change |
|---|---|---|---|
| 1st | Tesla Model Y | 394,497 | 0 |
| 2nd | Tesla Model 3 | 220,910 | 0 |
| 3rd | Chevrolet Bolt EV/EUV | 62,045 | 0 |
| 4 | Ford Mustang Mach-E | 40,771 | 0 |
| 5 | Volkswagen ID.4 | 37,789 | 0 |
| 6 | Hyundai IONIQ 5 | 33,918 | 0 |
| 7 | Rivian R1S | 24,783 | 2 |
| 8 | Ford F-150 Lightning | 24,165 | 6 |
| 9 | Tesla Model X | 23,015 | 2 |
| 10 | BMW i4 | 22,583 | 2 |
Source: PwC Autofacts Analysis, Electric Vehicle Sales Review Q4, 2023, pg. 7.
China Top EV Models in 2023 – by Sales Volume Q1 – Q3 2023
| Position | Model | Sales FY 2023 | Position Change |
|---|---|---|---|
| 1st | Tesla Model Y | 456,394 | 0 |
| 2nd | BYD Yuan Plus | 309,835 | 1 |
| 3rd | BYD Dolphin | 299,708 | 1 |
| 4 | BYD Seagull | 239,270 | 3 |
| 5 | Wuling Hongguang Mini EV | 237,863 | 0 |
| 6 | AIon Y | 235,717 | 0 |
| 7 | Aion S | 220,904 | 3 |
| 8 | Wuling Bingo | 167,764 | 1 |
| 9 | Tesla Model 3 | 167,764 | 1 |
| 10 | Changan Lumin | 147,270 | 2 |
Source: PwC Autofacts Analysis, Electric Vehicle Sales Review Q4, 2023, pg. 7.
Shifts in Government incentives
S&P global projects global sales for battery electric passenger vehicles to reach 13.3 million units for 2024 – accounting for an estimated 16.2% of global passenger vehicle sales.
Despite this optimistic outlook, many national governments are looking to reduce or eliminate incentives for consumers to take up EVs due to economic downturns and reining in government spending. For example, the German government has curbed the €4,500 subsidy for EV purchases 12 months ahead of schedule as part of addressing their ongoing budget crisis. New Zealand’s newly elected National government also scrapped the Clean Car Discount Scheme rebate on low-emission vehicles at the end of 2023.
In France, their cash incentive scheme now tracks a car’s “environmental footprint” as the determinant for how much of the €7,000 subsidy a consumer will receive. Domestically produced cars will receive the full subsidy, while cars manufactured further away (and therefore need to be transported using fossil fuels) will receive a reduced benefit – or none at all.
The European Union and United Kingdom are also investigating a 10% tariff on Chinese-produced vehicles, as the Chinese Communist Party government subsidises the manufacture of EVs which means they can be sold cheaply in the EU, leaving European manufacturers at a competitive disadvantage.
Battery technology and charging infrastructure
Our past survey of Australian consumers showed that 51% of 1,000 adults surveyed said that a lack of charging infrastructure was a major barrier to EV entry, as was reduced driving range (39%) compared to Internal Combustion Engine (ICE) vehicles.
As Australia is 7.7 million km² worth of landmass, a car with a sub-400km range would leave many with anxieties as to whether they would run out of charge between stations.
Chinese EV manufacturer Nio has developed a battery offering a range of 1,000km – enough to handle the Melbourne to Sydney run with 120km left in reserve – which will be going into mass production this month (April 2024.)
EV batteries have depended on less than scrupulous supply chains to source nickel, cobalt, and lithium for battery production; though now there is a push for the cheaper and more reliable Sodium-ion technology to surpass Lithium-ion as the de facto standard.
Another innovation produced in a joint venture between Volvo and Polestar manufacturer Geely and Chinese firm Nio is the battery swapping station, which dispenses with long charging times by removing a depleted battery and substituting it for a full one instead of waiting for the original battery to charge.
The used EV market
As more EVs enter the general vehicle fleet around the world, so comes the opportunity to buy used models at a fraction of the price of buying new. A PwC 2023 eReadiness survey which analysed 18 global markets showed that 60% of EV owners showing an interest in buying a used car: the rate being 75% in North America and 71% in Europe.
Interestingly, EVs depreciated in price 10% more than comparable ICE vehicles, with budget models losing the most value over time. A used EV is a more straightforward purchase than an ICE vehicle, as there are fewer models to choose from at this time.
Growth in EV sales
EV sales growth has continued in all major markets (Western Europe, China, and the United States) with 2.025 million units sold in December 2023, a year-on-year increase of 26%. The year-to-date sales figures topped 18.17 million, an increase of 31% year-on-year.
Battery Electric Vehicle (BEVs) sales reached 9.47 million in all major markets (year on year increase of 27%), with China taking the majority of sales. Plug-in Electric Hybrids (PHEVs) sold 3.84 million units, an increase of 51% year-on-year.
China
As previously mentioned, China recorded over 2 million sales of BEVs over 2023. The results of the most recent quarter increased the overall number of BEV sales in 2023 to more than 6.6 million, indicating a 24% rise over the year before. In 2023, there will be 2.8 million PHEV sales, indicating a much smaller market. But its rate of increase was 84% throughout the course of the year, significantly higher than previous.
Western Europe
Western Europe (the Top Four plus the United Kingdom) recorded a 23% increase in BEV sales in 2023, accounting to 1.3 million vehicles sold. This even surpassed ICE performance (9% growth.) Spain saw the largest increase at 66%, albeit the total number was small compared to Germany, which recorded four times the BEV sales of Italy and Spain put together.
PHEV sales decreased by 13% in Western Europe, with a 52% drop recorded in Germany largely in part due to their sudden repeal of subsidies.
The other five nations in Western Europe – Austria, Switzerland, Netherlands, Norway, and Sweden – The Netherlands and Austria had the biggest gains in BEV sales among the other European markets in 2023, with rises of 59% and 39%, respectively. Sales of BEVs in Norway, which has the largest BEV market globally at an 82% share fell by 24%, albeit at a slower rate than the market as a whole. Impressive BEV market shares of 38% and 34%, respectively, were also seen in Sweden and the Netherlands.
BEV Sales in the Western Europe: France, Germany, Italy, Spain & UK (BEV, PHEV & Hybrid)
| WE 5+5 | Q4 2023 | Comparison to Q4 2022 |
|---|---|---|
| BEV | 461,000 | -12% |
| PHEV | 216,000 | -24% |
| Hybrid | 749,000 | +30% |
| Total EV | 1,426,000 | +3% |
Source: Strategy& PwC, Electric Vehicle Sales Review Q4, 2023, pg. 12.
United States
The United States one million BEV milestone also saw with it a 54% increase in sales year over year. The market share of BEVs in 2023 was 7%, nearly tripling in only two years. Government subsidies, aggressive goals to cut car emissions, the regular release of well-received new models, and the advancement of the nation's infrastructure for charging vehicles may all be attributed to the sharp increase. The BEV market share was less than 3% in 2021.
PHEV and HEVs also saw large growth at 57% and 44% respectively. The ICE market only saw an 8% increase in sales over last year, much like the numbers coming out of Europe.
BEV Sales in the United States (BEV, PHEV & Hybrid)
| USA | Q4 2023 | Comparison to Q4 2022 |
|---|---|---|
| BEV | 281,000 | +31% |
| PHEV | 87,000 | +75% |
| Hybrid | 330,000 | +61% |
| Total EV | 698,000 | +49% |
Source: Strategy& PwC, Electric Vehicle Sales Review Q4, 2023, pg. 12.
Asia
Japanese BEV sales saw an increase of 39% during 2023, despite coming from low numbers overall – BEVs only comprise under 2% of all market share. PHEVs share 2% of the market overall – and 55% of the EV market. ICE growth slowed to 3%. In South Korea, there was little good news for EV sales as it increased by only 1% after several years of steady growth. In 2021, the BEV market grew by an incredible 132%. The ICE market declined due to economic stagnation, slumping 5% overall.
BEV Sales in the China (BEV, PHEV & Hybrid)
| China | Q4 2023 | Comparison to Q4 2022 |
|---|---|---|
| BEV | 2,173,000 | +22% |
| PHEV | 997,000 | +75% |
| Hybrid | 330,000 | +61% |
| Total EV | 698,000 | +49% |
Source: Strategy& PwC, Electric Vehicle Sales Review Q4, 2023, pg. 12.
EV registrations
EV registrations in Western Europe during 2023 numbered 5.36 million out of 10.32 million – more than half of all registrations. 1.7 million were BEVs and 2.88 million were hybrids.
2.58 million EVs were registered in the United States out of 15.46 million vehicles. 1.18 million were hybrids, 290,000 were PHEVs, and 1.12 million were BEVs.
EV registrations in China topped the scale at 10.3 million out of 30 million, representing 22.2% of all registrations. 6.66 million were BEVs and 2.79 million were PHEVs.
In Australia, hybrid EV registrations rose by 31% annually, with over 362,000 vehicles.
Future EV model launches
Though many exciting launches are slated for 2024, manufacturers such as Acura, Audi, Ford, Honda, and Polestar have announced new models for launch through to 2026. Hyundai has promised an iteration on its hugely popular Ioniq 4 and 8 in 2026, with new Polestar marques coming in succession over 2025-2027.
| Brand | Model | Launch | Quarter |
| BYD | Sealion 07 | 2024 | Q2 |
| Cadillac | Symboliq | 2024 | Q2 |
| Dodge | Daytona | 2024 | Q2 |
| IM | L5 | 2024 | Q1 |
| Jeep | Recon | 2024 | Q4 |
| Kia | EV3 | 2024 | Q2 |
| Lancia | Ypsilon | 2024 | Q2 |
| Lingxi | Lingxi L | 2024 | Q4 |
| Maruti-Suzuki | eVX | 2024 | Q3 |
| Mercedes-Benz | EQG | 2024 | Q2 |
| MI | SU7 | 2024 | Q1 |
| Mini | Aceman | 2024 | Q2 |
| Renault | 5 | 2024 | Q1 |
| Venucia | Star EV | 2024 | Q4 |
| VinFast | VF 3 | 2024 | Q3 |
Source: Strategy& PwC, Electric Vehicle Sales Review Q4, 2023, pg. 18.
| Brand | Model | Launch |
| Acura | RDX EV | 2025 |
| Audi | A4 e-tron | 2028 |
| Audi | A8 e-tron | 2027 |
| Audi | Urbansphere | 2025 |
| BMW | iX5 | 2026 |
| Buick | Regal EV | 2025 |
| Buick | Verano Pro | 2027 |
| Chery | Omoda 3 | 2025 |
| Chevrolet | Monza | 2026 |
| Chrysler | Pacifica EV | 2028 |
| Fisker | PEAR | 2025 |
| Ford | Maverick EV | 2028 |
| Foxtron | Model B | 2026 |
| Foxtron | Project X | 2026 |
| Honda | Passport EV | 2027 |
| Honda | Pilot EV | 2027 |
| Hyundai | Ioniq 4 | 2026 |
| Hyundai | Ioniq 8 | 2026 |
| Kia | EV8 | 2027 |
| Lotus | Elise | 2027 |
| Mahindra | BE.05 | 2025 |
| Maruti-Suzuki | Ertiga | 2025 |
| Polestar | Polestar 5 | 2025 |
| Polestar | Polestar 6 | 2026 |
| Polestar | Polestar 7 | 2027 |
| Skyworth | Skyhome | 2025 |
| Toyota | bZ2 | 2028 |
| Toyota | Granvia EV | 2028 |
| Volkswagen | ID.2 | 2026 |
| Volkswagen | ID.3 X | 2026 |
Source: Strategy& PwC, Electric Vehicle Sales Review Q4, 2023, pg. 19-20.
| Dec-23 YTD | Market Share | Dec-22 YTD | YTD – YoY | Q4-23 | QoY | Dec-23 | MoY | Nov-23 | MoY | Oct-23 | MoY | ||
| BEV | 298,216 | 16.80% | 203,121 | 46.80% | 93,601 | 50.60% | 37,358 | 49.50% | 30,770 | 51.60% | 25,473 | 51.00% | |
| PHEV | 162,952 | 9.20% | 126,549 | 28.80% | 46,529 | 22.50% | 17,059 | 17.30% | 14,540 | 17.80% | 14,930 | 34.40% | |
| Hybrid | 432,290 | 24.40% | 332,663 | 29.90% | 128,680 | 35.90% | 48,135 | 32.60% | 40,053 | 35.80% | 40,492 | 40.10% | |
| Total EV | 893,458 | 50.30% | 662,333 | 34.90% | 268,810 | 38.00% | 102,552 | 35.30% | 85,363 | 37.40% | 80,895 | 42.20% | |
| France | Other | 881,276 | 49.70% | 866,702 | 1.70% | 217,295 | -2.20% | 78,461 | -4.60% | 67,346 | -6.20% | 71,488 | 5.00% |
| BEV | 524,219 | 18.40% | 470,559 | 11.40% | 136,930 | -30.90% | 54,654 | -47.60% | 44,942 | -22.50% | 37,334 | 4.30% | |
| PHEV | 175,724 | 6.20% | 362,093 | -51.50% | 52,379 | -64.20% | 17,894 | -74.40% | 18,124 | -59.30% | 16,361 | -49.00% | |
| Hybrid | 664,580 | 23.40% | 465,228 | 42.90% | 173,725 | 44.10% | 55,687 | 38.00% | 60,463 | 38.40% | 57,575 | 57.90% | |
| Total EV | 1,364,523 | 48.00% | 1,297,880 | 5.10% | 363,034 | -21.90% | 128,235 | -40.20% | 123,529 | -15.50% | 111,270 | 6.70% | |
| Germany | Other | 1,480,086 | 52.00% | 1,353,477 | 9.40% | 343,509 | 7.90% | 113,648 | 13.80% | 122,172 | 6.90% | 107,689 | 3.20% |
| BEV | 66,283 | 4.20% | 49,169 | 34.80% | 20,514 | 54.20% | 6,806 | 50.60% | 7,948 | 55.40% | 5,760 | 57.20% | |
| PHEV | 69,008 | 4.40% | 64,632 | 6.80% | 16,009 | -6.60% | 4,482 | -12.40% | 5,747 | -9.80% | 5,780 | 2.40% | |
| Hybrid | 565,431 | 36.10% | 450,938 | 25.40% | 145,726 | 22.00% | 38,855 | 6.00% | 52,679 | 30.20% | 54,192 | 28.00% | |
| Total EV | 700,722 | 44.80% | 564,739 | 24.10% | 182,249 | 21.60% | 50,143 | 8.30% | 66,374 | 27.80% | 65,732 | 27.30% | |
| Italy | Other | 864,807 | 55.20% | 752,187 | 15.00% | 207,139 | 8.50% | 60,968 | 3.90% | 72,852 | 7.20% | 73,319 | 14.20% |
| BEV | 58,865 | 6.20% | 35,398 | 66.30% | 17,004 | 53.50% | 5,896 | 44.70% | 6,053 | 56.90% | 5,055 | 60.60% | |
| PHEV | 62,473 | 6.60% | 48,197 | 29.60% | 17,045 | 26.50% | 6,546 | 40.90% | 5,509 | 14.00% | 4,990 | 24.80% | |
| Hybrid | 306,342 | 32.30% | 243,468 | 25.80% | 82,310 | 19.80% | 27,924 | 22.80% | 26,918 | 7.40% | 27,468 | 31.50% | |
| Total EV | 427,680 | 45.00% | 327,063 | 30.80% | 116,359 | 24.80% | 40,366 | 28.30% | 38,480 | 14.00% | 37,513 | 33.80% | |
| Spain | Other | 521,680 | 55.00% | 486,312 | 7.30% | 121,619 | 1.50% | 41,406 | -2.50% | 39,834 | 0.90% | 40,379 | 6.50% |
| BEV | 314,684 | 16.50% | 267,203 | 17.80% | 76,143 | -16.90% | 27,841 | -34.20% | 24,359 | -17.10% | 23,943 | 20.10% | |
| PHEV | 141,311 | 7.40% | 101,413 | 39.30% | 42,318 | 54.20% | 12,162 | 45.40% | 15,871 | 55.80% | 14,285 | 60.50% | |
| Hybrid | 601,071 | 31.60% | 479,992 | 25.20% | 139,332 | 22.20% | 41,838 | 31.90% | 49,757 | 24.00% | 47,737 | 13.20% | |
| Total EV | 1,057,066 | 55.50% | 848,608 | 24.60% | 257,793 | 10.60% | 81,841 | -0.60% | 89,987 | 12.90% | 85,965 | 21.10% | |
| UK | Other | 845,988 | 44.50% | 765,455 | 10.50% | 193,353 | 12.00% | 59,251 | 28.50% | 66,538 | 5.30% | 67,564 | 6.70% |
| BEV | 1,262,267 | 14.00% | 1,025,450 | 23.10% | 344,192 | -8.50% | 132,555 | -26.40% | 114,072 | -2.20% | 97,565 | 22.90% | |
| PHEV | 611,468 | 6.80% | 702,884 | -13.00% | 174,280 | -28.10% | 58,143 | -43.30% | 59,791 | -23.60% | 56,346 | -8.70% | |
| Hybrid | 2,569,714 | 28.40% | 1,972,289 | 30.30% | 669,773 | 29.50% | 212,439 | 26.60% | 229,870 | 28.50% | 227,464 | 33.20% | |
| Total EV | 4,443,449 | 49.20% | 3,700,623 | 20.10% | 1,188,245 | 4.60% | 403,137 | -10.50% | 403,733 | 8.00% | 381,375 | 22.30% | |
| WE 5 | Other | 4,593,837 | 50.80% | 4,224,133 | 8.80% | 1,082,915 | 5.80% | 353,734 | 7.40% | 368,742 | 3.40% | 360,439 | 6.70% |
Source: Strategy& PwC, Electric Vehicle Sales Review Q4, 2023, pg. 21.
| Dec-23 YTD | Market Share | Dec-22 YTD | YTD – YoY | Q4-23 | QoY | Dec-23 | MoY | Nov-23 | MoY | Oct-23 | MoY | ||
| BEV | 47,621 | 19.90% | 34,165 | 39.40% | 12,727 | 26.50% | 4,019 | 1.20% | 4,330 | 26.20% | 4,378 | 64.60% | |
| PHEV | 16,956 | 7.10% | 13,268 | 27.80% | 3,871 | 1.10% | 1,146 | -6.80% | 1,213 | -21.10% | 1,512 | 42.40% | |
| Hybrid | 50,630 | 21.20% | 40,858 | 23.90% | 12,247 | 18.10% | 3,865 | 10.90% | 4,129 | 9.80% | 4,253 | 36.10% | |
| Total EV | 115,207 | 48.20% | 88,291 | 30.50% | 28,845 | 18.90% | 9,030 | 3.90% | 9,672 | 10.80% | 10,143 | 48.10% | |
| Austria | Other | 123,943 | 51.80% | 126,759 | -2.20% | 27,419 | -0.60% | 9,467 | 6.20% | 9,228 | -2.30% | 8,724 | -5.30% |
| BEV | 123,949 | 33.50% | 78,012 | 58.90% | 31,619 | 10.50% | 11,881 | -16.80% | 10,478 | 39.30% | 9,260 | 36.20% | |
| PHEV | 47,081 | 12.70% | 34,535 | 36.30% | 8,946 | 8.60% | 2,323 | 13.70% | 3,153 | 9.60% | 3,470 | 4.60% | |
| Hybrid | 161,220 | 43.60% | 77,951 | 106.80% | 37,994 | 80.40% | 13,449 | 136.90% | 12,744 | 74.60% | 11,801 | 46.00% | |
| Total EV | 332,250 | 89.80% | 190,498 | 74.40% | 78,559 | 35.70% | 27,653 | 25.60% | 26,375 | 49.00% | 24,531 | 34.80% | |
| Netherlands | Other | 37,541 | 10.20% | 121,631 | -69.10% | 4,579 | -84.50% | -1,076 | -112.10% | 1,861 | -81.50% | 3,794 | -64.20% |
| BEV | 104,589 | 82.40% | 138,286 | -24.40% | 24,915 | -57.30% | 8,957 | -72.60% | 8,442 | -47.00% | 7,516 | -22.70% | |
| PHEV | 10,170 | 8.00% | 14,857 | -31.50% | 3,527 | -22.20% | 1,954 | 2.60% | 938 | -37.50% | 635 | -43.60% | |
| Hybrid | 7,584 | 6.00% | 9,464 | -19.90% | 1,900 | -49.90% | 709 | -48.90% | 702 | -50.90% | 489 | -49.90% | |
| Total EV | 122,343 | 96.40% | 162,607 | -24.80% | 30,342 | -54.50% | 11,620 | -67.70% | 10,082 | -46.50% | 8,640 | -27.00% | |
| Norway | Other | 4,612 | 3.60% | 11,722 | -60.70% | 1,114 | -77.20% | 563 | -83.90% | 266 | -60.10% | 285 | -60.90% |
| BEV | 112,775 | 37.80% | 96,163 | 17.30% | 30,990 | -16.70% | 11,408 | -37.30% | 10,128 | -7.70% | 9,454 | 17.60% | |
| PHEV | 61,235 | 20.50% | 66,775 | -8.30% | 18,184 | -5.70% | 7,101 | -13.90% | 5,321 | -6.00% | 5,762 | 7.10% | |
| Hybrid | 28,537 | 9.60% | 28,355 | 0.60% | 8,105 | 11.20% | 2,580 | 13.60% | 3,047 | 16.00% | 2,478 | 3.60% | |
| Total EV | 202,547 | 67.90% | 191,293 | 5.90% | 57,279 | -10.20% | 21,089 | -26.60% | 18,496 | -3.90% | 17,694 | 11.90% | |
| Sweden | Other | 95,560 | 32.10% | 107,927 | -11.50% | 24,073 | 11.40% | 8,605 | 20.30% | 7,432 | 5.60% | 8,036 | 8.40% |
| BEV | 52,728 | 20.90% | 40,172 | 31.30% | 16,493 | 20.70% | 7,240 | 5.60% | 4,748 | 8.10% | 4,505 | 87.00% | |
| PHEV | 23,220 | 9.20% | 18,336 | 26.60% | 7,009 | 49.40% | 2,782 | 63.60% | 2,164 | 29.00% | 2,063 | 56.80% | |
| Hybrid | 68,830 | 27.30% | 56,121 | 22.60% | 19,039 | 17.90% | 7,074 | 23.50% | 6,235 | 12.20% | 5,730 | 17.80% | |
| Total EV | 144,778 | 57.40% | 114,629 | 26.30% | 42,541 | 23.30% | 17,096 | 19.70% | 13,147 | 13.10% | 12,298 | 43.20% | |
| Switzerland | Other | 107,436 | 42.60% | 111,286 | -3.50% | 26,767 | -7.20% | 9,852 | -5.70% | 8,858 | -9.50% | 8,057 | -6.30% |
| BEV | 1,703,929 | 16.50% | 1,412,248 | 20.70% | 460,936 | -12.10% | 176,060 | -31.30% | 152,198 | -4.20% | 132,678 | 21.70% | |
| PHEV | 770,130 | 7.50% | 850,655 | -9.50% | 215,817 | -23.80% | 73,449 | -37.50% | 72,580 | -20.70% | 69,788 | -5.60% | |
| Hybrid | 2,886,515 | 28.00% | 2,185,038 | 32.10% | 749,058 | 30.00% | 240,116 | 28.90% | 256,727 | 28.70% | 252,215 | 32.60% | |
| Total EV | 5,360,574 | 51.90% | 4,447,941 | 20.50% | 1,425,811 | 3.10% | 489,625 | -12.60% | 481,505 | 7.00% | 454,681 | 21.80% | |
| WE 5+5 | Other | 4,962,929 | 48.10% | 4,703,458 | 5.50% | 1,166,867 | 2.70% | 381,145 | 3.50% | 396,387 | 0.70% | 389,335 | 4.00% |
Source: Strategy& PwC, Electric Vehicle Sales Review Q4, 2023, pg. 22.
| Dec-23 YTD | Market Share | Dec-22 YTD | YTD – YoY | Q4-23 | QoY | Dec-23 | MoY | Nov-23 | MoY | Oct-23 | MoY | ||
| BEV | 87,217 | 7.20% | 33,416 | 161.00% | 21,474 | 84.40% | 6,771 | 33.20% | 8,646 | 94.00% | 6,057 | 188.00% | |
| PHEV | 11,212 | 0.90% | 5,937 | 88.80% | 4,469 | 230.30% | 1,302 | 183.00% | 1,429 | 233.10% | 1,738 | 274.60% | |
| Hybrid | 98,437 | 8.10% | 81,790 | 20.40% | 28,708 | 27.80% | 9,875 | 39.40% | 9,646 | 13.10% | 9,187 | 33.90% | |
| Total EV | 196,866 | 16.20% | 121,143 | 62.50% | 54,651 | 54.10% | 17,948 | 42.20% | 19,721 | 47.00% | 16,982 | 80.10% | |
| Australia | Other | 1,019,914 | 83.80% | 960,286 | 6.20% | 262,843 | 11.90% | 80,596 | 7.00% | 92,420 | 13.20% | 89,827 | 15.40% |
| BEV | 19,309 | 0.90% | 8,458 | 128.30% | 11,585 | 412.40% | 6,018 | 570.20% | 3,197 | 339.80% | 2,370 | 272.60% | |
| PHEV | 33,637 | 1.50% | 10,348 | 225.10% | 12,796 | 310.80% | 5,353 | 326.20% | 4,004 | 423.40% | 3,439 | 214.40% | |
| Hybrid | 40,981 | 1.90% | 30,439 | 34.60% | 12,036 | 24.50% | 4,908 | 43.00% | 3,400 | -2.90% | 3,728 | 36.60% | |
| Total EV | 93,927 | 4.30% | 49,245 | 90.70% | 36,417 | 142.10% | 16,279 | 191.40% | 10,601 | 112.20% | 9,537 | 113.80% | |
| Brazil | Other | 2,086,298 | 95.70% | 1,911,217 | 9.20% | 608,971 | 11.20% | 220,456 | 12.20% | 191,233 | 2.20% | 197,282 | 20.10% |
| BEV | 6,657,000 | 22.20% | 5,351,000 | 24.40% | 2,173,000 | 22.10% | 825,000 | 32.20% | 702,000 | 14.10% | 646,000 | 19.40% | |
| PHEV | 2,787,400 | 9.30% | 1,515,559 | 83.90% | 997,000 | 87.80% | 364,000 | 93.10% | 323,000 | 89.60% | 310,000 | 80.10% | |
| Hybrid | 853,190 | 2.80% | 818,993 | 4.20% | 255,100 | 32.50% | 95,000 | 46.60% | 78,800 | 30.60% | 81,300 | 20.70% | |
| Total EV | 10,297,590 | 34.30% | 7,685,552 | 34.00% | 3,425,100 | 36.80% | 1,284,000 | 46.40% | 1,103,800 | 30.50% | 1,037,300 | 32.90% | |
| China* | Other | 19,747,410 | 65.70% | 19,163,448 | 3.00% | 5,553,900 | 13.70% | 1,872,000 | 11.50% | 1,866,200 | 25.90% | 1,815,700 | 5.30% |
| BEV | 82,336 | 1.60% | 38,754 | 112.50% | 21,325 | 79.70% | 7,401 | 90.10% | 7,145 | 77.50% | 6,779 | 71.80% | |
| PHEV | 309 | 0.00% | 13 | 2274.20% | 84 | 8264.20% | 31 | 0.00% | 28 | 0.00% | 25 | 2400.00% | |
| Hybrid | 340,174 | 6.50% | 191,920 | 77.20% | 84,392 | 7.50% | 27,790 | 12.10% | 28,182 | 8.10% | 28,420 | 2.70% | |
| Total EV | 422,819 | 8.00% | 230,687 | 83.30% | 105,801 | 17.00% | 35,221 | 22.80% | 35,355 | 17.50% | 35,224 | 11.40% | |
| India** | Other | 4,844,876 | 92.00% | 4,709,358 | 2.90% | 1,206,376 | -2.80% | 402,270 | 4.70% | 399,829 | -3.70% | 404,278 | -8.40% |
| BEV | 17,062 | 2.20% | 10,327 | 65.20% | 6,885 | 5.50% | 3,206 | 33.40% | 1,942 | -1.20% | 1,737 | -19.50% | |
| PHEV | 70 | 0.00% | 10 | 600.00% | 5 | 0.00% | 1 | 0.00% | 2 | 0.00% | 2 | 0.00% | |
| Hybrid | 51,132 | 6.60% | 5,100 | 902.60% | 17,024 | 419.50% | 6,260 | 173.50% | 6,248 | 653.70% | 4,516 | 2740.30% | |
| Total EV | 68,264 | 8.80% | 15,437 | 342.20% | 23,914 | 143.90% | 9,467 | 101.70% | 8,192 | 193.20% | 6,255 | 170.10% | |
| Indonesia | Other | 711,062 | 91.20% | 768,126 | -7.40% | 176,968 | -12.50% | 59,523 | -12.30% | 59,861 | -7.80% | 57,584 | -17.10% |
| BEV | 43,991 | 1.70% | 31,592 | 39.20% | 10,516 | 12.40% | 3,803 | -8.10% | 3,331 | 1.90% | 3,382 | 73.20% | |
| PHEV | 52,143 | 2.00% | 37,772 | 38.00% | 12,446 | 71.10% | 3,607 | 14.20% | 4,661 | 113.40% | 4,178 | 116.30% | |
| Hybrid | 1,460,133 | 55.10% | 1,089,077 | 34.10% | 373,644 | 26.10% | 116,759 | 26.10% | 134,112 | 26.50% | 122,773 | 25.70% | |
| Total EV | 1,556,267 | 58.70% | 1,158,441 | 34.30% | 396,606 | 26.70% | 124,169 | 24.30% | 142,104 | 27.40% | 130,333 | 28.40% |
Source: Strategy& PwC, Electric Vehicle Sales Review Q4, 2023, pg. 23.
| Dec-23 YTD | Market Share | Dec-22 YTD | YTD – YoY | Q4-23 | QoY | Dec-23 | MoY | Nov-23 | MoY | Oct-23 | MoY | ||
| BEV | 17,100 | 3.60% | 11,293 | 51.40% | 4,900 | 44.90% | 1,700 | 38.20% | 1,900 | 62.00% | 1,300 | 32.80% | |
| PHEV | 13,200 | 2.80% | 9,664 | 36.60% | 3,800 | 60.40% | 1,500 | 88.90% | 1,100 | 49.70% | 1,200 | 42.90% | |
| Hybrid | 187,300 | 39.40% | 136,948 | 36.80% | 55,000 | 63.90% | 19,700 | 52.30% | 17,200 | 59.70% | 18,100 | 83.60% | |
| Total EV | 217,600 | 45.80% | 157,905 | 37.80% | 63,700 | 62.00% | 22,900 | 53.10% | 20,200 | 59.30% | 20,600 | 76.40% | |
| Poland | Other | 257,430 | 54.20% | 261,844 | -1.70% | 61,015 | -4.30% | 19,217 | -12.30% | 21,485 | -0.20% | 20,313 | 0.00% |
| BEV | 156,767 | 9.00% | 155,432 | 0.90% | 42,365 | 5.80% | 11,117 | 87.10% | 15,829 | 2.80% | 15,419 | -17.50% | |
| PHEV | 10,796 | 0.60% | 13,114 | -17.70% | 2,220 | -30.70% | 877 | -15.50% | 816 | -32.70% | 527 | -44.80% | |
| Hybrid | 374,314 | 21.50% | 259,731 | 44.10% | 113,767 | 61.20% | 39,865 | 48.60% | 41,139 | 65.30% | 32,763 | 73.60% | |
| Total EV | 541,877 | 31.20% | 428,277 | 26.50% | 158,352 | 39.10% | 51,859 | 53.40% | 57,784 | 39.20% | 48,709 | 26.50% | |
| South Korea | Other | 1,197,373 | 68.80% | 1,255,975 | -4.70% | 286,723 | -17.50% | 91,390 | -28.20% | 102,692 | -10.30% | 92,641 | -12.50% |
| BEV | 64,515 | 6.70% | 7,733 | 734.30% | 30,967 | 742.20% | 11,289 | 643.20% | 10,591 | 730.70% | 9,087 | 929.10% | |
| PHEV | 2,468 | 0.30% | 1,005 | 145.60% | 712 | 52.10% | 269 | 52.00% | 227 | 77.30% | 216 | 32.50% | |
| Hybrid | 102,327 | 10.60% | 63,382 | 61.40% | 34,020 | 47.70% | 15,522 | 80.10% | 10,399 | 24.20% | 8,099 | 34.10% | |
| Total EV | 169,310 | 17.50% | 72,120 | 134.80% | 65,699 | 141.80% | 27,080 | 162.60% | 21,217 | 117.00% | 17,402 | 145.70% | |
| Turkey | Other | 797,031 | 82.50% | 520,540 | 53.10% | 234,752 | 41.20% | 99,336 | 29.90% | 70,207 | 42.00% | 65,209 | 61.60% |
| BEV | 1,118,286 | 7.20% | 725,064 | 54.20% | 280,996 | 30.80% | 100,928 | 27.70% | 89,559 | 37.10% | 90,509 | 28.50% | |
| PHEV | 289,569 | 1.90% | 184,823 | 56.70% | 86,846 | 74.80% | 40,127 | 104.80% | 24,682 | 69.10% | 22,037 | 42.40% | |
| Hybrid | 1,176,833 | 7.60% | 816,422 | 44.10% | 330,271 | 60.70% | 117,690 | 62.90% | 108,782 | 74.60% | 103,799 | 46.20% | |
| Total EV | 2,584,688 | 16.70% | 1,726,308 | 49.70% | 698,113 | 48.50% | 258,745 | 51.40% | 223,023 | 56.80% | 216,345 | 37.90% | |
| USA | Other | 12,877,275 | 83.30% | 11,927,300 | 8.00% | 3,149,444 | 2.80% | 1,174,521 | 7.50% | 997,294 | 2.00% | 977,629 | -1.70% |
| BEV | 9,967,512 | 14.00% | 7,785,317 | 28.00% | 3,064,949 | 17.50% | 1,153,293 | 17.20% | 996,338 | 14.30% | 915,318 | 21.70% | |
| PHEV | 3,970,934 | 5.60% | 2,628,900 | 51.00% | 1,336,195 | 51.60% | 490,516 | 47.50% | 432,529 | 53.40% | 413,150 | 54.80% | |
| Hybrid | 7,571,336 | 10.60% | 5,678,840 | 33.30% | 2,053,020 | 35.80% | 693,485 | 38.20% | 694,635 | 35.90% | 664,900 | 33.40% | |
| Total EV | 21,509,782 | 30.30% | 16,093,056 | 33.70% | 6,454,164 | 29.10% | 2,337,293 | 28.50% | 2,123,502 | 27.60% | 1,993,368 | 31.40% | |
| Analyzed | Other | 49,596,728 | 69.70% | 47,246,414 | 5.00% | 12,951,152 | 6.70% | 4,476,915 | 7.40% | 4,280,090 | 10.60% | 4,194,148 | 2.30% |
| Markets |
Source: Strategy& PwC, Electric Vehicle Sales Review Q4, 2023, pg. 24.
Did you find this page helpful?
This guide provides general information and does not consider your individual needs, finances or objectives. We do not make any recommendation or suggestion about which product is best for you based on your specific situation and we do not compare all companies in the market, or all products offered by all companies. It’s always important to consider whether professional financial, legal or taxation advice is appropriate for you before choosing or purchasing a financial product.
The content on our website is produced by experts in the field of finance and reviewed as part of our editorial guidelines. We endeavour to keep all information across our site updated with accurate information.
Approval for car loans is always subject to our lender’s terms, conditions and qualification criteria. Lenders will undertake a credit check in line with responsible lending obligations to help determine whether you’re in a position to take on the loan you’re applying for.
The interest rate, comparison rate, fees and monthly repayments will depend on factors specific to your profile, such as your financial situation, as well others, such as the loan’s size and your chosen repayment term. Costs such as broker fees, redraw fees or early repayment fees, and cost savings such as fee waivers, aren’t included in the comparison rate but may influence the cost of the loan. Different terms, fees or other loan amounts may result in a different comparison rate.